Click here to download this week's dataset as a CSV
Click here to download this week's dataset as a Hyper Extract
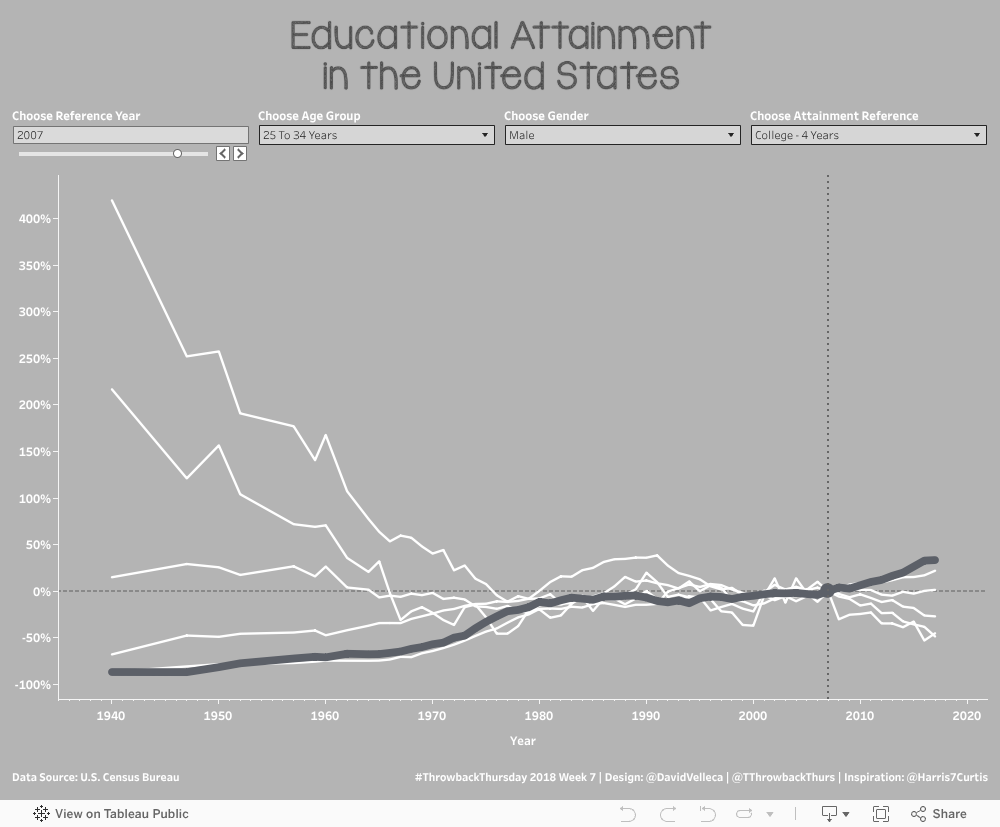
Data Storytelling
When I first downloaded this data, I knew that I wanted to look at the changes over time. It struck me that 1.4M people aged 25 to 34 reported that the highest education they received was, at best, 4 years of elementary school. Fortunately, this number decreased over the time period in the data (1940 - 2017), as did the number of those reporting only 5-8 years of elementary and also the number of people only attending 1-3 years of high school.
On the flip side, the number of people who reported graduating from high school, attending some college (inluding getting their Associate's degree) and finally graduating from college increased. Even without the knowledge, or highlighting, of what was going on in the United States during this time that was driving these changes (desegregation, Title XI, Cold War, etc.), the changes are visible.
The viz, though containing one line per level of educational attainment, allows for the audience to see where trends change. In 1991, when looking at both genders aged 25-34, the trend changes - the number of people who completed only their high school degree begins to drop, and the trend switches to college.
Data Viz Approach
As I said, I knew that I wanted to look at how the trends changed over time, but I wasn't 100% sure on how I wanted to do this. I started with a line graph that showed the difference from the 1940, but this view was static. I was nearly done with that view, when I remembered a Workout Wednesday challenge by Andy Kriebel inspired by Curtis Harris.
The viz is really interactive, with parameters allowing the user to change the frame of reference, both from the year perspective, but also from which attainment level is highlighted. The highlighting was possible with my first view, but the ability to change the time reference was not. This view was exactly what I was looking for.
There are several level of detail calculations that drive the viz, so this was a fun way for me to use these LOD skills that I don't always get to use in my daily life. In addition to these LOD calcs, I also used quite a few calculated fields to drive the text in my tooltips.
I decided to keep the viz relatively clean with no labels, or legends. Instead, I used tooltips with all of the data that I would have labeled the viz with, as well as much more. I hope you enjoy the viz!
Data Notes
There are a few notes on the data this week:
- Values are in thousands;
- Until 1959, the 'total' figure includes persons who did not report on their number of years of schooling completed; and
- In 1992, the Census questions changed, influencing the data as follows:
- 'High School Graduate' falls into the 'High School - 4 Years' category, meaning that regardless of the number of years required to graduate (early graduates), graduates are counted as completing 4 years;
- Those completing 'Some College' or their Associates Degree fall into the 'College 1-3 Years' bucket;
- The 'College 4 Years' bucket includes those attaining their Bachelor's, Master's, Doctorate or Professional degrees; and
- Because of these changes, the median years completed is unavailable.
Data Source
This week's data source comes from the United States Census Bureau. We used Table A-1, "Years of school completed by people 25 years and over by age and sex."
Information for this historical background comes from the American Board.
The splash image for this post comes from my alma mater, The University of Missouri. While not staking a claim to the oldest university in America, it does hold the title of the oldest land grant university west of the Mississippi River. The picture depicts Academic Hall prior to the 1892 fire that destroyed all of the building but the six ionic columns that featured at the Hall's entrance. After the fire, the board and community rallied to have the columns remain on campus. Today, they are one of the best known symbols of the University, featuring prominently during televised sporting events and in SEC commercials. Go Tigers!